Inter-Basin SST Contrasts during a North
Pacific Marine Heatwave: Co-occurring Mid-Latitude Pacific Cooling and North
Atlantic Cold Anomaly
summarized by Marcus Thomas Kirchner Sept. 01 2025
mk@nbri.info
This is a
preliminary, non–peer-reviewed manuscript submitted for open discussion
NBRI climate
research
Exploring, Documenting, and Preserving
Northern Biodiversitythern Biodiversity
Resea
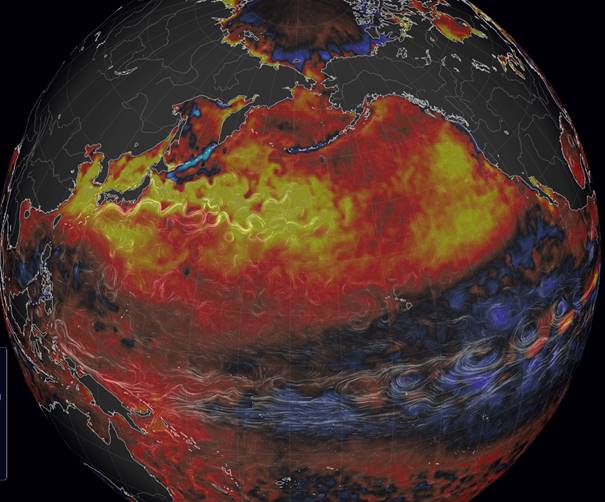
Current North Pacific Ocean
Heat Anomaly (September 2025)
The North Pacific Ocean is currently
experiencing one of the most severe marine heatwaves ever recorded.
·
Regional averages (NOAA, Mercator Ocean
International) show +2 to +3 °C above normal in broad zones of the mid-latitude
Pacific and the Sea of Japan.
·
Local hotspots, as visualized by Nullschool
(NOAA OI SST data), exceed +5 °C above normal, particularly off Japan, around
Hokkaidō, and in the western Pacific gyre.
This combination of widespread warming and
extreme local peaks highlights the extraordinary intensity of the present
anomaly.
Impacts:
·
Ecosystems: Deoxygenation, plankton regime
shifts, fish mortality, and jellyfish blooms.
·
Weather: Amplified evaporation drives
stronger typhoons, senjō kōsuitai (linear rainbands), and prolonged humid
heatwaves in East Asia.
·
Teleconnections: Altered jet stream
patterns influence weather extremes in North America and Europe.
·
Climate feedbacks: Persistent marine
heatwaves point to long-term changes in circulation (Kuroshio Extension,
Aleutian Gyre) and amplify global warming through additional water vapor.
Sources and Monitoring:
·
NOAA Marine Heatwave Tracker (California
Current & NE Pacific “Blob”): https://www.integratedecosystemassessment.noaa.gov/regions/california-current/california-current-marine-heatwave-tracker-blobtracker
·
NOAA Coral Reef Watch – Global Daily SST
Anomaly Maps: https://coralreefwatch.noaa.gov/product/5km/index_5km_ssta.php
- Mercator
Ocean International – Ocean Temperature Bulletin (July 2025): https://www.mercator-ocean.eu/bulletin/ocean-tempeature-bulletin-july-205/
- Mercator
Ocean International – Marine Heatwave Forecast (August 2025): https://www.mercator-ocean.eu/bulletin/marine-heatwave-forecast-9-august-2025-2/
- Visualization
of local anomalies (> +5 °C): https://earth.nullschool.net

NOAA
Data Aug. 27 2025 - northern pacific - in some areas more than +5° C anomaly.
Northern
Pacific
Sea
Surface Temperature Anomaly SSTA Data 09 Sept. 2025
Source: OI SST V2.1 / PSL / NOAA
“Data: NOAA GFS 0.25°, visualization by
Cameron Beccario, earth.nullschool.net, accessed 09 Sept 2025.”
Japan and Sakhalin NOAA Data Aug. 27 2025
Sea Surface Temperature Anomaly SSTA Data 09 Sept. 2025
Source: OI SST V2.1 / PSL / NOAA
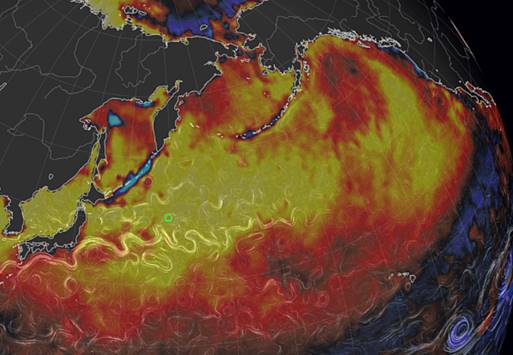
Interpreting the Graphic:
North Pacific Sea Surface Temperature Anomalies
The image shows sea surface
temperature anomalies (SSTA) in the Northwest Pacific,
covering Japan,
Sakhalin, the Kuril Islands, Kamchatka, and the Aleutian–Alaska region.
Data source: NOAA OISST v2.1, visualized on earth.nullschool.net.
Color scale:
·
Yellow / orange / red = warmer than average (+ anomalies, up to >
+5 °C).
·
Blue / turquoise = cooler than average (– anomalies).
Streamlines: White lines show surface currents,
including swirling eddies.
Key Patterns
1. Warm hotspot east of Japan
o
Broad yellow–red zones mark +3 to
+5 °C anomalies along the Kuroshio Extension.
o
Numerous eddies trap and redistribute warm
water, creating localized peaks above +5 °C.
2. Sharp frontal contrasts
o
South of Hokkaidō and the Kurils, warm
Kuroshio waters meet cold Oyashio waters.
o
This explains the striking juxtaposition of
warm
anomalies (red/yellow) next to cooler patches
(blue).
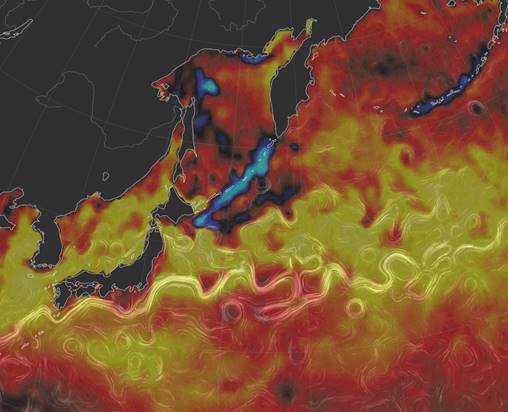
3. Japan Sea and Sakhalin region
o
Mixed anomalies (warm and cool) reflect strong
local dynamics, wind forcing, and exchanges through narrow straits (e.g.,
Sōya/La Pérouse Strait).
4. Bering Sea and Gulf of Alaska
o
Large red fields show persistent
positive anomalies, reminiscent of past “Blob” events
(2013–2016).
Physical Interpretation
·
Heat transport & eddies: The Kuroshio carries
large heat volumes eastward; eddies store and recirculate this heat, delaying
cooling.
·
Frontal dynamics: The Kuroshio–Oyashio boundary creates sharp
thermal gradients, easily shifted by winds and currents.
·
Air–sea coupling: Reduced heat loss to the atmosphere under
stable weather patterns allows anomalies to accumulate; localized upwelling
produces cooler spots.
Key
Takeaways
·
Extremely warm surface waters
dominate the Northwest Pacific, with regional anomalies of +2 to +3 °C
and local
hotspots exceeding +5 °C.
·
Frontal zones around Japan, Sakhalin, and the Kurils
display strong contrasts, driven by Kuroshio–Oyashio interactions.
·
Such anomalies are not absolute temperatures, but
deviations from the climatological mean (1982–2010 baseline).
·
Local peaks vs. averages: While NOAA and
Mercator report +2 to +3 °C regional means, this
visualization reveals localized extremes above +5 °C.
NOAA Data Aug. 27 2025
Sea
Surface Temperature Anomaly SSTA Data 09 Sept. 2025
Source: OI SST V2.1 / PSL / NOAA
“Data: NOAA GFS 0.25°, visualization by
Cameron Beccario, earth.nullschool.net, accessed 09 Sept 2025.”
NOAA
Data Aug. 27 2025
Sea
Surface Temperature Anomaly SSTA Data 09 Sept. 2025
Source: OI SST V2.1 / PSL / NOAA
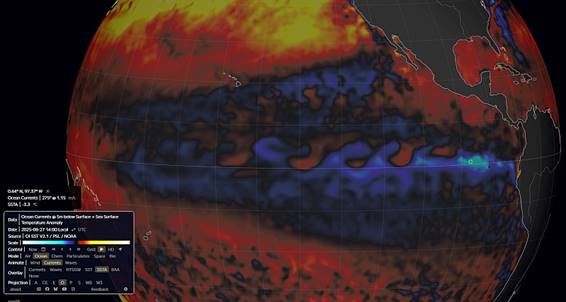
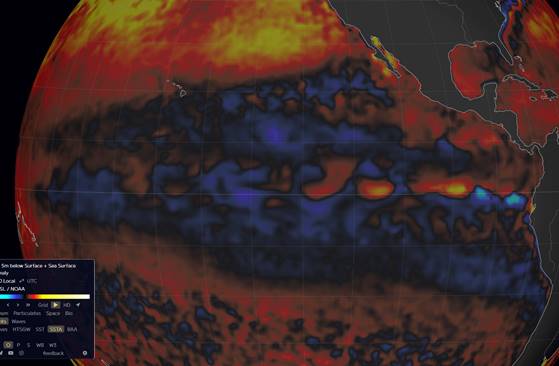
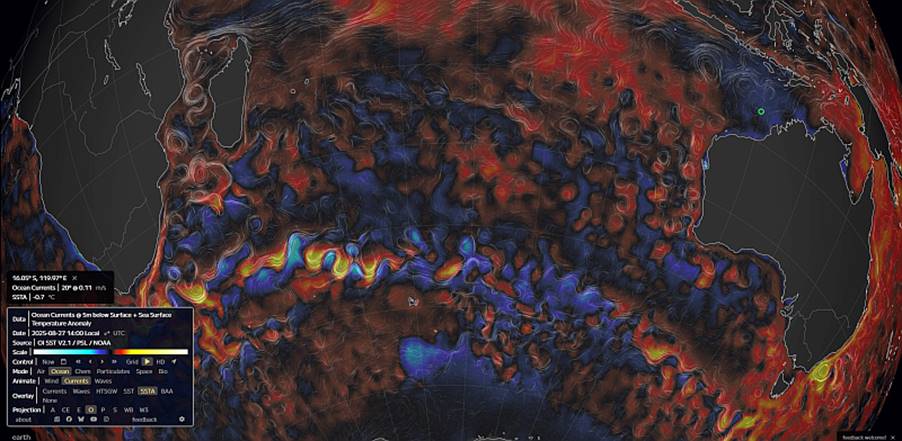
This visualizations highlight an extraordinary
contrast in global sea surface temperature anomalies (SSTA):
·
Equatorial Pacific (La Niña):
A continuous blue
band across the tropical Pacific shows –1 to –2 °C anomalies.
This is the clear signature of a La Niña event, driven by
stronger trade winds and the upwelling of cold subsurface water.
·
North Pacific Hotspot:
In sharp contrast, the North Pacific (Japan, Bering Sea, Gulf
of Alaska) displays vast red and yellow zones,
with anomalies reaching +3 to +5 °C. Warm water
displaced westward by La Niña accumulates in the western and northern Pacific,
fueling unprecedented marine heatwaves.
·
North Atlantic “Cold Blob”:
South of Greenland, cooler-than-average waters signal a weakened Atlantic
Meridional Overturning Circulation (AMOC), reducing heat
transport into northern Europe.
Why
this matters
·
Energy shift: Heat removed from the equatorial Pacific
during La Niña is redistributed to the western Pacific and North Pacific
mid-latitudes, creating regional hotspots.
·
Atmosphere–ocean feedback: The La Niña cooling plus
the North Pacific warming destabilize large-scale circulation (Walker cell, jet
stream), driving weather extremes.
·
Regional impacts:
o
East Asia: stronger monsoons, typhoons, and
record-breaking heat.
o
North America: altered storm tracks,
droughts, and heat domes.
o
Europe: the Atlantic cold anomaly increases
the risk of colder winters.
Summary Statement
This images capture a triple anomaly
pattern rarely observed:
·
Cold tropics (La Niña)
·
Hot North Pacific (+5 °C hotspots)
·
Cold North Atlantic (AMOC “cold blob”)
Together,
these signals indicate that the global ocean–atmosphere system is shifting into
an unstable
state, with far-reaching impacts on ecosystems, regional
climates, and extreme weather.
New Research Spotlight – Atlantic–Pacific Link
A 2025 study by Yamagami et al. (Gulf
Stream drives Kuroshio behind the recent abnormal ocean warming)
demonstrates that variability in the North Atlantic Gulf Stream region drives
ocean warming in the North Pacific Kuroshio Extension.
·
Atlantic → Pacific coupling: Positive SST anomalies
in the Gulf Stream trigger a Northern Annular Mode-like circulation,
weakening the Aleutian Low. This shifts the Kuroshio Extension northward,
enhancing warm water transport and generating positive SST
anomalies across the North Pacific.
·
One-way influence: The study found no significant reverse
effect from the Kuroshio back to the Gulf Stream.
·
High-resolution models: Climate models with
fine ocean resolution reproduce this coupling best, underscoring the role of
mesoscale eddies.
These findings identify the North
Atlantic as a key pacemaker of mid-latitude climate variability,
with direct implications for understanding the current extreme
North Pacific marine heatwaves observed in 2025.
Source: Yamagami et al., 2025 – Gulf Stream drives
Kuroshio behind the recent abnormal ocean warming
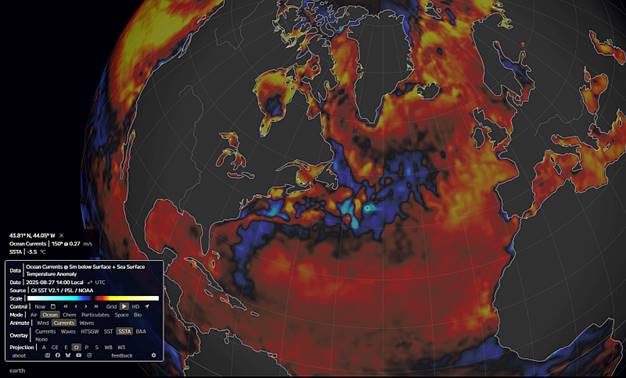
What the graphic shows (NOAA OISST
v2.1, 27 August 2025)
·
North Atlantic
o
Strong red/orange anomalies
along the U.S. East Coast and Gulf Stream extension → +2 to +4 °C.
o
A persistent “cold blob” south of
Greenland (blue patch), again reflecting weakened heat
transport by the Atlantic Meridional Overturning Circulation (AMOC).
·
Caribbean & Gulf of Mexico
o
Almost uniformly +2 to +3 °C above
normal, providing record-high ocean heat content.
o
These waters act as “fuel” for hurricanes →
more intense tropical cyclones possible in late 2025 season.
·
South Atlantic (near Brazil, West Africa)
o
Alternating warm and cool anomalies, linked
to changes in the Atlantic Niño and cross-equatorial wind
stress.
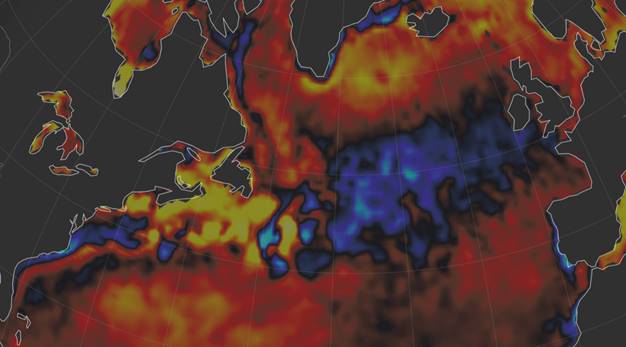
·
Equatorial Pacific & Eastern Pacific
o
Clear blue anomaly band
(–1 to –2 °C) along the equator = La Niña
signature.
o
Off Peru/Ecuador → cold upwelling
intensified, while just north/south of the equator the water
remains warmer.
·
Eastern Pacific (off California)
o
Strong positive anomalies, linked to
regional upwelling changes and ongoing marine heatwave activity in the
Northeast Pacific.
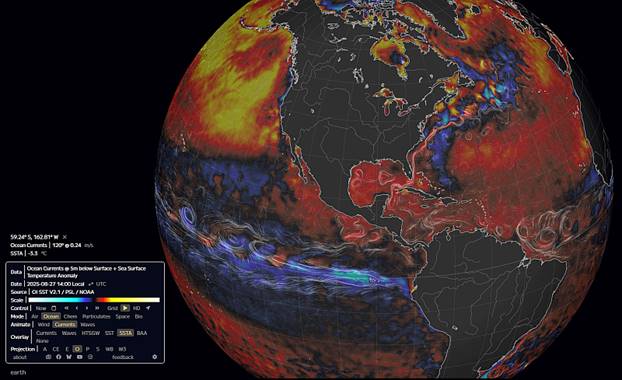
Why this
matters
·
Dual Atlantic signal:
o
Warm along U.S. East Coast → stronger
hurricane potential.
o
Cold blob south of Greenland → linked to
AMOC slowdown, affecting European climate and winter patterns.
·
La Niña + Atlantic warm pool:
o
This combination typically shifts the Walker
circulation and jet streams, altering rainfall in South
America, Africa, and Asia.
o
Increases likelihood of heavier
hurricanes in the Atlantic and drier conditions
in parts of South America.
·
Global coupling:
o
The Atlantic anomalies (warm + cold blob)
interact with the Pacific (La Niña), producing large-scale atmospheric wave
trains that reshape global climate extremes.
In summary:
This map shows how the Atlantic and Pacific anomalies are
locked into a coupled pattern:
·
La Niña cooling in the Pacific,
·
North Atlantic cold blob near Greenland,
·
Extreme warm pools in the Gulf of Mexico and along the U.S. East Coast.
Together, these signals strongly influence hurricane
activity, monsoon rainfall, and Europe’s upcoming winter climate.
Regional Cold Anomalies –
South Atlantic & Northern Australia
In addition to the dramatic warming in the
North Pacific, several regions of the global ocean currently show significant
cold anomalies:
·
South Atlantic (west of southern Africa):
Cooler-than-average waters (–0.5 to –2 °C) are linked to enhanced Benguela
upwelling and the Atlantic Niño pattern.
These anomalies influence rainfall across West Africa, with potential impacts
on the Sahel
rainy season.
·
Northern Australia and the Maritime Continent:
Cold anomalies (–0.5 to –1.5 °C) in the Timor and Arafura Seas reflect the
influence of the ongoing La Niña. Stronger trade
winds drive warm water westward into the Indonesian seas, while local upwelling
cools the northern Australian margins. The result: wetter conditions
over Indonesia but a tendency toward drier climate in
northern Australia.
Global
Context
These cold pools are part of a broader
three-pole anomaly pattern:
·
Tropical Pacific: La Niña cooling.
·
North Pacific: Extreme marine heatwaves (+3 to +5 °C).
·
North Atlantic: Persistent “cold blob” south of
Greenland.
·
South Atlantic & Northern Australia:
Secondary cold anomalies tied to regional upwelling and ENSO dynamics.
Together, these hotspots and cold pools
highlight the highly disrupted state of the global ocean–atmosphere
system in 2025, with cascading effects on monsoons, storm
tracks, and regional climates.
“Data: NOAA GFS 0.25°, visualization by
Cameron Beccario, earth.nullschool.net, accessed 09 Sept 2025.”
NOAA
Data Aug. 27 2025
Sea
Surface Temperature Anomaly SSTA Data 09 Sept. 2025
Source: OI SST V2.1 / PSL / NOAA
“Data: NOAA GFS 0.25°, visualization by
Cameron Beccario, earth.nullschool.net, accessed 09 Sept 2025.”
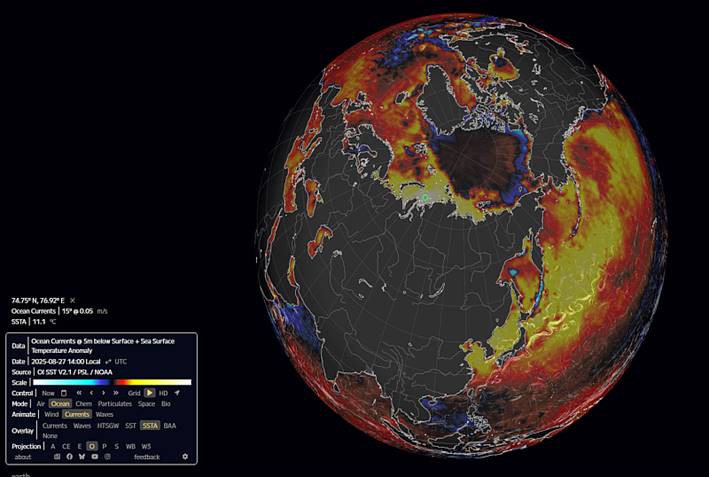
Arctic marine heatwaves have reached extraordinary levels,
with average sea surface temperatures in August 2023 spiking 5–7 °C
above normal, and absolute readings surpassing 11 °C
in the Barents, Kara, Laptev, and Beaufort Seas—a clear signal
of Arctic Amplification driven by sea-ice loss and solar heat uptake. These
extremes have moderated somewhat by August 2024 (2–4 °C anomalies), yet
long-term warming trends remain significant. This warming not only destabilizes
Arctic ecosystems but also disrupts global climate systems through feedbacks
into ice cover, ocean heat storage, and atmospheric circulation.
Summary
In boreal summer–autumn 2025, the North
Pacific maintained a large, persistent marine heatwave (MHW) with moderate to
locally severe–extreme categories—including the Sea of Okhotsk and waters
adjacent to Japan—against a background of record-high global ocean warmth. At
the same time, the subpolar North Atlantic retained a cool anomaly (“cold
blob”) embedded within a warm Atlantic. The Siberian Arctic (Kara–Laptev shelf
seas) saw exceptionally warm summer conditions, closely tied to low sea-ice
cover and strong surface fluxes over newly open water. Recent work by Yamagami
et al. (2025) provides a dynamical Atlantic→Pacific teleconnection—from Gulf
Stream SSTs via a Northern-Annular-Mode–like atmospheric pattern to a
northward-shifted Kuroshio Extension—that helps explain coherent extratropical
SST anomalies across the basins in 2025.
Mercator Ocean International data portal: https://www.mercator-ocean.eu
1) North Pacific and waters around Japan
(2025): persistent MHW with Okhotsk intensification
Operational bulletins through late September
show the North Pacific (120°W–120°E) MHW “stable in extent and intensity”, with
moderate to strong and locally severe categories; in the Sea of Okhotsk, the
affected area expanded with severe to extreme pockets. In Japanese marginal
seas, typhoon-mixed, short-lived cool pulses did not overturn the positive mean
SST anomaly regime. In the longer context, SST around Japan has warmed +1.33 °C
per century, roughly twice the global ocean rate, preconditioning the region
for frequent, persistent warm seasons and MHWs.
Mercator Ocean International bulletin (20
September 2025): https://www.mercator-ocean.eu/bulletin/marine-heatwave-bulletin-20-september-2025/
2) North Atlantic “cold blob” (2025):
structure, drivers, and Pacific relevance
Weekly anomaly summaries in July–September
2025 continued to show a subpolar gyre cool pool south of Greenland (typical −2
°C to +3 °C weekly anomalies basin-wide, with negative departures in the
cold-blob core), superimposed on otherwise warm North Atlantic backgrounds.
Mechanistically, the cold blob reflects heat-transport divergence associated
with AMOC variability and subpolar gyre dynamics, partly offset by anomalous
ocean heat uptake.
Recent 2025 studies highlight key drivers:
- Li et al. (2025). “Weakened Atlantic Meridional
Overturning Circulation causes cooling in the subpolar North Atlantic
‘warming hole’.” Communications Earth & Environment. URL: https://www.nature.com/articles/s43247-025-02403-0
3) A 2025 Atlantic→Pacific bridge: Gulf Stream
→ NAM-like pattern → Kuroshio Extension
Yamagami et al. (2025) demonstrate a causal
link from Gulf Stream SST variability to the Kuroshio region in multi-model
ensembles: positive Gulf Stream anomalies excite a NAM-like atmospheric
pattern, weaken the Aleutian Low, shift the Kuroshio Extension northward, and
enhance warm-water advection into the Northwest Pacific. Roughly 16 % of
internal SST variance in the Kuroshio sector is explained by internal Gulf
Stream variability; the reverse (Pacific→Atlantic) influence is not
significant.
Yamagami Y., Tatebe H., Kohyama T., Kido S.,
Okajima S. (2025). “Gulf Stream drives Kuroshio behind the recent abnormal
ocean warming.” arXiv preprint. URL: https://arxiv.org/abs/2503.01117
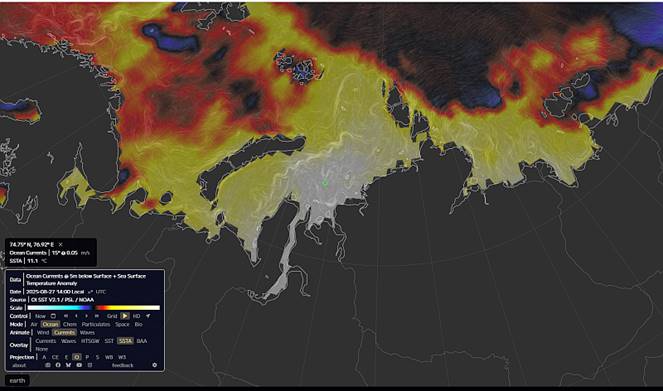
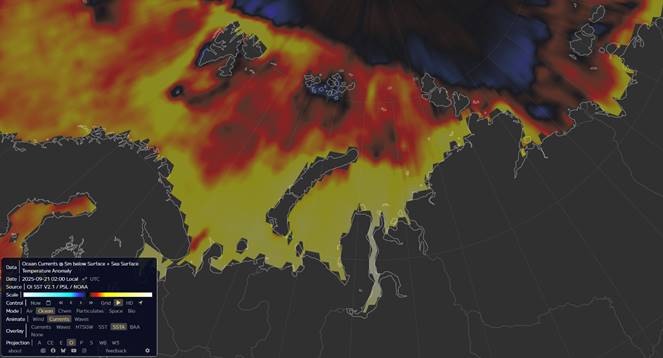
4) Siberian Arctic (Kara–Laptev shelf): why
local 2-m air-temperature anomalies ≥ +10 °C can occur in summer 2025
Authoritative 2025 diagnostics show very low
summer sea-ice along the Eurasian shelf (Kara–Laptev), with Arctic daily extent
ranking third lowest at end-July and large areas of open water along the
Northern Sea Route. Satellite commentary in mid-July highlighted “frigid air
meeting warmer open water” over the Laptev Sea, consistent with strong surface
heat fluxes and cloud-street formation. UK Met Office briefings singled out
Kara/Laptev as warmest relative to average in July 2025. ERA5 anomaly maps for
July show strong positive 2-m air-temperature departures over newly ice-free
waters; synoptic analyses in late summer show 925-hPa anomalies of +5 to +7 °C
under persistent ridging over the Siberian coast. Over short time/space scales
where ridge-induced warm advection passes over newly opened, dark ocean, local
2-m anomalies ≥ +10 °C (and occasionally higher) are physically
expected—monthly means are lower but still markedly positive.
Sources:
- Copernicus Climate Change Service (2025). “Surface air
temperature – July 2025.” URL: https://climate.copernicus.eu/surface-air-temperature-july-2025
- National Snow and Ice Data Center (NSIDC). “Sea Ice
Today – The Peak of Summer, the Depths of Winter.” 11 August 2025.
URL: https://nsidc.org/sea-ice-today/analyses/peak-summer-depths-winter - NASA Earth Observatory. “Cloud Streets Over the Laptev
Sea.” 17 July 2025.
URL: https://earthobservatory.nasa.gov/images/154559/cloud-streets-over-the-laptev-sea - UK Met Office. “Briefing on Arctic and Antarctic Sea
Ice – August 2025.”
URL: https://www.metoffice.gov.uk/research/approach/monitoring/sea-ice/2025/briefing-on-arctic-and-antarctic-sea-ice---august-2025
5) Integrated Perspective
- The North Pacific sustained MHW conditions
through late summer 2025, with Japan-adjacent seas persistently warm and
the Sea of Okhotsk reaching severe–extreme levels.
- The North Atlantic cold blob persisted despite a
warm Atlantic, consistent with AMOC/gyre dynamics and ocean–atmosphere
feedbacks documented in 2025 studies.
- The Siberian Arctic registered exceptional local
summer warmth tied to sea-ice loss, stratified shelf waters, and synoptic
ridging/air–sea fluxes—conditions favorable for event-scale 2-m anomalies
≥ +10 °C.
- Yamagami et al. (2025)
provide a dynamical bridge from Atlantic variability to Pacific
boundary-current shifts, supplying a mechanistic explanation for the
coherent cross-basin pattern observed in 2025.
Conclusion and Outlook
The year 2025 highlights the importance
of inter-basin ocean–atmosphere coupling.
- A persistent North Pacific marine heatwave,
including Japan’s marginal seas, occurred simultaneously with a sub-polar
North Atlantic “cold blob” and exceptional Arctic warmth north of
Siberia.
- Recent modelling (Yamagami et al., 2025)
demonstrates that variability in the Gulf Stream can trigger a
Northern-Annular-Mode–like response, weakening the Aleutian Low and shifting
the Kuroshio Extension northward. This mechanism provides a causal
bridge between Atlantic and Pacific anomalies, explaining why
extratropical SST patterns were coherent across basins in 2025.
- In the Arctic, double-digit positive 2-m
air-temperature anomalies were physically consistent with extensive
sea-ice loss, strong ice–albedo feedback, river-driven
surface freshening, and synoptic ridging, reinforcing the
broader signal of Arctic amplification.
Outlook
- Seasonal to decadal forecasts
should explicitly incorporate Atlantic–Pacific teleconnections, as
these mechanisms affect western boundary currents, storm tracks,
and marine ecosystem stress in regions such as Japan’s coastal
seas.
- Continued AMOC monitoring is essential: further
weakening could strengthen the cold blob and modulate downstream
atmospheric patterns that influence Pacific MHW frequency and intensity.
- In the Arctic, the combination of low summer sea-ice
extent, enhanced river discharge, and stratified shelf
waters suggests that episodes of > +10 °C surface-air anomalies
may become more common, with implications for permafrost thaw, methane
release, and Northern Sea Route shipping conditions.
- Multi-basin predictive systems—linking observational
networks (Argo, moorings, satellite) and high-resolution coupled
models—will be crucial for early warning of compound events such as
those observed in 2025.
This synthesis underscores that future
marine extremes around Japan, the North Atlantic, and the Arctic cannot be
treated in isolation. The 2025 event suite demonstrates how regional
anomalies are connected through large-scale dynamics, and how climate-driven
teleconnections are likely to intensify.